Simulating (Verilated-Model Runtime)
This section describes items related to simulating, that is, using a Verilated model’s executable. For the runtime arguments to a simulated model, see Simulation Runtime Arguments.
Simulation Summary Report
When simulation finishes, it will print a report to stdout summarizing the
simulation. This requires the model being Verilated with --main,
or the user’s main() calling VerilatedContext->statsPrintSummary().
The report may be disabled with +verilator+quiet.
For example:
- S i m u l a t i o n   R e p o r t: Verilator ...
- Verilator: End at simtime 123 ns; walltime 1234.001 s; speed 123 ns/s
- Verilator: cpu 22.001 s on 4 threads; allocated 123 MB
The information in this report is:
- "Verilator ..."
Program version.
- "End at simtime 123 ns"
Verilog $time at which the model finished or stopped.
- "walltime 1234.001 s"
Real elapsed wall time in seconds.
- "speed 123.1 ns/s"
Simulated time (if non-zero) divided by wall time. e.g. 123 ns/s means 123 simulated nanoseconds took 1 second of wall time; for a model with only a 1 GHz clock that would be equivalent to 123.1 cycles per second. The units are automatically selected to give a number between 1 and 1000. The wall time includes initialization, initial and final process blocks, so indicates a slower speed than if the model had a longer runtime.
- "cpu 22 s"
CPU time used total across all CPU threads in seconds.
- "4 threads"
Number of simultaneous threads used.
- "allocated 123 MB"
Total memory used during simulation in megabytes.
Benchmarking & Optimization
For best performance, run Verilator with the -O3
--x-assign fast --x-initial fast --no-assert options. The -O3 option will
require a longer time to run Verilator, and --x-assign fast --x-initial fast may increase the risk
of reset bugs in trade for performance. The --no-assert will
suppress checking assertions, which is faster and appropriate for
known-good models running software, but may hide design errors. See the
above documentation for these options.
If using Verilated multithreaded, consider overriding Verilator’s default
thread-to-processor assignment by using numactl; see
Multithreading. If your OS can handle thread assignment for your
design and hardware well, consider disabling Verilator’s NUMA assignment by
setting the VERILATOR_NUMA_STRATEGY environment variable to
none; see Environment. Also, consider using profile-guided
optimization; see Thread Profile-Guided Optimization.
Minor Verilog code changes can also give big wins. You should not have any
UNOPTFLAT warnings from Verilator. Fixing these warnings can
result in huge improvements; one user fixed their one UNOPTFLAT warning by
making a simple change to a clocked latch used to gate clocks and gained a
60% performance improvement.
Beyond that, the performance of a Verilated model depends primarily on your C++ compiler and the size of your CPU’s caches. Experience shows that the instruction cache size often limits large models, and reducing code size, if possible, can be beneficial.
The supplied $VERILATOR_ROOT/include/verilated.mk file uses the OPT, OPT_FAST, OPT_SLOW, and OPT_GLOBAL variables to control optimization. You can set these when compiling the output of Verilator with Make, for example:
make OPT_FAST="-Os -march=native" -f Vour.mk Vour__ALL.a
OPT_FAST specifies optimization options for those parts of the model on the
fast path. This is mostly code that is executed every cycle. OPT_SLOW
applies to slow-path code, which rarely executes, often only once at the
beginning or end of the simulation. OPT_SLOW is ignored if
VM_PARALLEL_BUILDS is not 1, in which case all generated code will be
compiled in a single compilation unit using OPT_FAST. See also the
Verilator --output-split option. The OPT_GLOBAL variable applies
to common code in the runtime library used by Verilated models (shipped in
$VERILATOR_ROOT/include). Additional C++ files passed on the verilator
command line use OPT_FAST. The OPT variable applies to all compilation
units and the specific “OPT” variables described above.
You can also use the -CFLAGS and/or -LDFLAGS options on
the verilator command line to pass arguments directly to the compiler or
linker.
The default values of the “OPT” variables are chosen to yield good simulation speed with reasonable C++ compilation times. To this end, OPT_FAST is set to “-Os” by default. Higher optimization such as “-O2” or “-O3” may help (though often they provide only a minimal performance benefit), but compile times may be excessively large even with medium-sized designs. Compilation times can be improved at the expense of simulation speed by reducing optimization, for example, with OPT_FAST=”-O0”. Often good simulation speed can be achieved with OPT_FAST=”-O1 -fstrict-aliasing” but with improved compilation times. Files controlled by OPT_SLOW have little effect on performance, and therefore OPT_SLOW is empty by default (equivalent to “-O0”) for improved compilation speed. In common use cases, there should be little benefit in changing OPT_SLOW. OPT_GLOBAL is set to “-Os” by default, and there should rarely be a need to change it. As the runtime library is small compared to many Verilated models, disabling optimization on the runtime library should not seriously affect overall compilation time but may have a detrimental effect on simulation speed, especially with tracing. In addition to the above, for best results, use OPT=”-march=native”, the latest Clang compiler (about 10% faster than GCC), and link statically.
Generally, the answer to which optimization level gives the best user experience depends on the use case, and some experimentation can pay dividends. For a speedy debug cycle during development, especially on large designs where C++ compilation speed can dominate, consider using lower optimization to get to an executable faster. For throughput-oriented use cases, for example, regressions, it is usually worth spending extra compilation time to reduce total CPU time.
If you will be running many simulations on a single model, you can investigate profile-guided optimization. See Compiler Profile-Guided Optimization.
Modern compilers also support link-time optimization (LTO), which can help, especially if you link in DPI code. To enable LTO on GCC, pass “-flto” in both compilation and link. Note that LTO may cause excessive compile times on large designs.
Unfortunately, using the optimizer with SystemC files can result in compilation taking several minutes. (The SystemC libraries have many little inlined functions that drive the compiler nuts.)
You may uncover further tuning possibilities by profiling the Verilog code. See Code Profiling.
When done optimizing, please let the author know the results. We like to keep tabs on how Verilator compares and may be able to suggest additional improvements.
Coverage Analysis
Verilator supports adding code to the Verilated model to support
SystemVerilog code coverage. With --coverage, Verilator enables
all forms of coverage:
When a model with coverage is executed, it will create a coverage file for collection and later analysis, see Coverage Collection.
Property Coverage
With --coverage or --coverage-user, Verilator will
translate property coverage points the user has inserted manually in
SystemVerilog code into the Verilated model.
For simple coverage points, use the cover property construct:
DefaultClock: cover property (@(posedge clk) cyc==3);
This adds a coverage point that tracks whether the condition has been observed.
Covergroup Coverage
With --coverage or --coverage-user, Verilator will
translate covergroup coverage points the user has inserted manually in
SystemVerilog code into the Verilated model. Verilator supports coverpoints
with value and transition bins, and cross points.
FSM Coverage
With --coverage or --coverage-fsm, Verilator can
instrument a conservative subset of FSMs and report both state coverage
(fsm_state) and transition coverage (fsm_arc).
This feature is currently experimental and might change in subsequent
releases. In particular, the native FSM coverage extraction heuristics,
--coverage-fsm, and the Verilator-specific FSM metacomments below
should be treated as subject to change while the interface settles.
FSM extraction is intentionally narrow. The current implementation targets clocked state machines that can be recovered directly from the RTL. It recognizes scalar enum, parameter, localparam, and selected literal state encodings in these common forms:
Single-process FSMs, whose state dispatch is written as
case (state)or as a top-levelif/else ifchain comparing the same state variable against known state valuesTwo-process and three-block FSMs, where a clocked state register is paired with a combinational next-state block using the same supported
caseor top-levelif/else ifdispatch forms
Scalar state encodings may be wider than 32 bits. This allows sparse state encodings, such as high-Hamming-distance enum or localparam values, to be preserved in the detected FSM model. Verilator uses the declared enum item name, parameter name, or localparam name as the reported state label where possible.
Simple input guards are supported when they appear inside a recognized
state branch, or as a top-level conjunction containing exactly one state
comparison, such as (state_q == IDLE) && ready. Directly traceable
pre-decoded state aliases, such as assign idle_state = (state_q ==
IDLE), may also be used in these guarded predicates.
Verilator does not claim broad support for arbitrary predicate decomposition, one-hot inference, helper-function next-state recovery, deeply nested control recovery, or cross-module state alias tracing.
The following metacomments may be attached to the state variable to steer the extracted coverage model:
/*verilator fsm_state*/forces the variable to be treated as FSM state./*verilator fsm_reset_arc*/marks reset transitions as user-visible reset arcs instead of defaulting to a hidden reset-only summary./*verilator fsm_arc_include_cond*/keeps conditional branch arcs that would otherwise be skipped by the conservative extractor.
State registers may also be wrapped by a transparent instance, for example a project flop wrapper or primitive. Such wrappers must be described explicitly with a VLT command file action before Verilator will use their data, state, clock, or reset connections for FSM extraction:
`verilator_config
fsm_register_wrapper -module "my_fsm_flop" -d "state_i" -q "state_o" -clock "clk_i"
The same command may be placed in a separate .vlt file:
fsm_register_wrapper -module "my_fsm_flop" -d "state_i" -q "state_o" -clock "clk_i"
Optional reset metadata may also be supplied:
fsm_register_wrapper -module "my_fsm_flop" -d "state_i" -q "state_o" -clock "clk_i" \
   -reset "rst_ni" -reset_value "ResetValue"
Reset arcs are emitted only when the configured reset port has an inferable edge in the wrapper and the configured reset value parameter is statically resolvable. If reset metadata is incomplete, Verilator warns and may still emit FSM state and transition coverage, but reset arcs are omitted.
Reset transitions are included in the collected data either way. By
default, verilator_coverage summarizes reset-only arcs rather
than printing them alongside non-reset arcs. Use
verilator_coverage --include-reset-arcs to include those arcs in
the printed summary and annotated output.
Annotated output produced by verilator_coverage --annotate will label FSM points with fsm_state and fsm_arc, and synthetic fallback transitions with SYNTHETIC DEFAULT ARC.
Line Coverage
With --coverage or --coverage-line, Verilator will
automatically add coverage analysis at each code flow change point (e.g.,
at branches). At each such branch, a counter is incremented. At the end of
a test, the counters, filename, and line number corresponding to each
counter are written into the coverage file.
Verilator may over-count combinatorial (non-clocked) blocks when those
blocks receive signals which have had the UNOPTFLAT warning
disabled; for the most accurate results, do not disable this warning when
using coverage.
Toggle Coverage
With --coverage or --coverage-toggle, Verilator will
automatically add toggle coverage analysis into the Verilated model.
Every bit of every signal in a module has a counter inserted, and the counter will increment on every edge change of the corresponding bit.
Signals that are part of tasks or begin/end blocks are considered local
variables and are not covered. Signals that begin with underscores (see
--coverage-underscore), are integers, or are very wide (>256 bits
total storage across all dimensions, see --coverage-max-width) are
also not covered.
Hierarchy is compressed, so if a module is instantiated multiple times, coverage will be summed for that bit across all instantiations of that module with the same parameter set. A module instantiated with different parameter values is considered a different module and will get counted separately.
Verilator makes a minimally-intelligent decision about what clock domain the signal goes to, and only looks for edges in that clock domain. This means that edges may be ignored if it is known that the receiving logic could never see the edge. This algorithm may improve in the future. The net result is that coverage may be lower than what would be seen by looking at traces, but the coverage is a more accurate representation of the quality of stimulus into the design.
There may be edges counted near time zero while the model stabilizes. It’s a good practice to zero all coverage just before releasing reset to prevent counting such behavior.
A /*verilator coverage_off*/
/*verilator coverage_on*/ metacomment pair can be used around
signals that do not need toggle analysis, such as RAMs and register files.
Expression Coverage
With --coverage or --coverage-expr, Verilator will
automatically add coverage analysis at each expression, indicating with a
truth table how every Boolean truth-table possibility in the expression
occurred.
Multi-bit expressions are ignored, but sub-expressions with are entirely Boolean are analyzed. Expression coverage does not fully explore the truth table of an expression, rather is looks at each term’s contribution. E.g. an AND operation will check coverage for TT, XF and FX.
Some expressions may produce too many cover points. Verilator limits the
maximum number of cover points per expression to 32, but this may be
controlled with --coverage-expr-max.
Below is an example showing expression coverage produced from verilator_coverage as applied to the condition expression inside an if statement. Each line shows the minimum number of terms and their values (e.g. (t1==0 && t2==1)) needed to reach a result for the overall expression (e.g. => 1). Each line also shows the number of times this combination was hit. Note that individual lines are not mutually exclusive.
%000004         if ((~t1 && t2) || (~t3 && t4)) $write("");
-000002  point: type=expr comment=(t1==0 && t2==1) => 1 hier=top.t
-000002  point: type=expr comment=(t1==1 && t3==1) => 0 hier=top.t
-000004  point: type=expr comment=(t1==1 && t4==0) => 0 hier=top.t
-000002  point: type=expr comment=(t2==0 && t3==1) => 0 hier=top.t
-000003  point: type=expr comment=(t2==0 && t4==0) => 0 hier=top.t
-000002  point: type=expr comment=(t3==0 && t4==1) => 1 hier=top.t
Suppressing Coverage
Using /*verilator coverage_off*/ and
/*verilator coverage_on*/ around a block of code will disable
and enable coverage respectively around that block. Or, use the
coverage_block_off control file option.
Verilator automatically disables coverage of lines and branches with a
$stop in them, as it is assumed that $stop branches contain an error check
that should not occur. A /*verilator coverage_block_off*/
metacomment will perform a similar function on any code in that block or
below.
Coverage Collection
When any coverage flag is used to Verilate, Verilator will add appropriate coverage point insertions into the model and collect the coverage data.
To get the coverage data from the model, write the coverage with either:
Using
--binaryor--main, and Verilator will dump coverage when the test completes to the filename specified with+verilator+coverage+file+<filename>.In the user wrapper code, typically at the end once a test passes, call
Verilated::threadContextp()->coveragep()->writewith an argument of the filename for the coverage data file to write coverage data to (typically “logs/coverage.dat”).
Run each of your tests in different directories, potentially in parallel.
Each test will create the file specified above, e.g.
logs/coverage.dat.
After running all of the tests, execute the verilator_coverage
command, passing arguments pointing to the filenames of all the individual
coverage files. verilator_coverage will read the
logs/coverage.dat file(s), and create an annotated source code
listing showing code coverage details.
verilator_coverage may also be used for test grading, computing which tests are important to give full verification coverage on the design.
For an example, see the examples/make_tracing_c/logs directory.
Grep for lines starting with ‘%’ to see what lines Verilator believes need
more coverage.
Additional options of verilator_coverage allow for the merging of coverage data files or other transformations.
Info files can be written by verilator_coverage for import to lcov. This enables using genhtml for HTML reports and importing reports to sites such as https://codecov.io.
Code Profiling
The Verilated model may be code-profiled using GCC or Clang’s C++ profiling mechanism. Verilator provides additional flags to help map the resulting C++ profiling results back to the original Verilog code responsible for the profiled C++ code functions.
To use profiling:
Make sure the Verilog code will call $finish at the end of simulation (otherwise the C library may not correctly create the gmon.out file in the later steps below).
Run Verilator, adding the
--prof-cfuncsoption.Build and run the simulation model.
The model will create gmon.out.
Run gprof gmon.out > gprof.log to see where in the C++ code the time is spent.
Run verilator_profcfunc gprof.log > profcfunc.log to take the gprof output and translate into output showing the Verilog line numbers on which most of the time is being spent.
Execution Profiling
For performance optimization, it is helpful to see statistics and visualize how execution time is distributed in a verilated model.
With the --prof-exec option, Verilator will:
Add code to the Verilated model to record execution flow.
Add code to save profiling data in non-human-friendly form to the file specified with
+verilator+prof+exec+file+<filename>.In multithreaded models, add code to record each macro-task’s start and end time across several calls to eval. (What is a macro-task? See the Verilator internals document (
docs/internals.rstin the distribution.)
The verilator_gantt program may then be run to transform the saved profiling file into a visual format and produce related statistics.
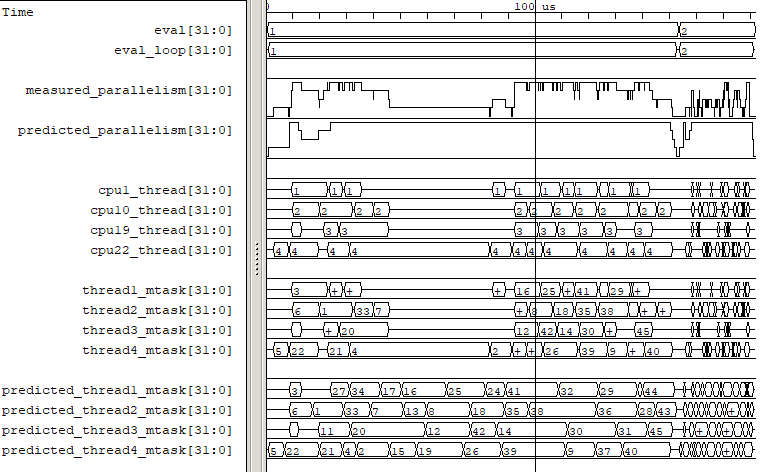
Fig. 1 Example verilator_gantt output, as viewed with GTKWave.
The measured_parallelism shows the number of CPUs being used at a given moment.
The cpu_thread section shows which thread is executing on each physical CPU.
The thread_mtask section shows which macro-task is running on a given thread.
For more information, see verilator_gantt.
Profiling ccache efficiency
The Verilator-generated Makefile supports basic profiling of ccache behavior during the build. This can be used to track down files that might be unnecessarily rebuilt, though as of today, even minor code changes will usually require rebuilding a large number of files.
To get a basic report of how well ccache is doing, add the ccache-report target when invoking the generated Makefile:
make -C obj_dir -f Vout.mk Vout ccache-report
This will print a report based on all executions of ccache during this invocation of Make. The report is also written to a file, in this example obj_dir/Vout__cache_report.txt.
To use the ccache-report target, OBJCACHE must be set to ‘ccache’ (this is done by configure if ‘ccache’ is installed). If no other explicit build targets are specified, cchache-report will build the default target.
This feature is currently experimental and might change in subsequent releases.
Save/Restore
The intermediate state of a Verilated model may be saved so that it may later be restored.
To enable this feature, use --savable. There are limitations in
what language features are supported along with --savable; if you
attempt to use an unsupported feature, Verilator will throw an error.
To use save/restore, the user wrapper code must create a VerilatedSerialize
or VerilatedDeserialze object and then call the << or >> operators
on the generated model and any other data the process needs to be
saved/restored. These functions are not thread-safe and are typically
called only by a main thread.
For example:
void save_model(const char* filenamep) {
    VerilatedSave os;
    os.open(filenamep);
    os << main_time;  // user code must save the timestamp
    os << *topp;
}
void restore_model(const char* filenamep) {
    VerilatedRestore os;
    os.open(filenamep);
    os >> main_time;
    os >> *topp;
}
Profile-Guided Optimization
Profile-guided optimization is the technique where profiling data is collected by running your simulation executable; then this information is used to guide the next Verilation or compilation.
There are two forms of profile-guided optimizations. Unfortunately, for best results, they must each be performed from the highest level code to the lowest, which means performing them separately and in this order:
Other forms of PGO may be supported in the future, such as clock and reset toggle rate PGO, branch prediction PGO, statement execution time PGO, or others, as they prove beneficial.
Thread Profile-Guided Optimization
Verilator supports profile-guided optimization (Verilation) of multithreaded models (Thread PGO) to improve performance.
When using multithreading, Verilator computes how long macro tasks take and
tries to balance those across threads. (What is a macro-task? See the
Verilator internals document (docs/internals.rst in the
distribution.) If the estimations are incorrect, the threads will not be
balanced, leading to decreased performance. Thread PGO allows collecting
profiling data to replace the estimates and better optimize these
decisions.
To use Thread PGO, Verilate the model with the --prof-pgo option.
This will code to the verilated model to save profiling data for
profile-guided optimization.
Run the model executable. When the executable exits, it will create a profile.vlt file.
Rerun Verilator, optionally omitting the --prof-pgo option and
adding the profile.vlt generated earlier to the command line.
Note there is no Verilator equivalent to GCC’s –fprofile-use. Verilator’s
profile data file (profile.vlt) can be placed directly on the
verilator command line without any option prefix.
If results from multiple simulations are to be used in generating the optimization, multiple simulation’s profile.vlt may be concatenated externally, or each file may be fed as separate command line options into Verilator. Verilator will sum the profile results, so a long-running test will have more weight for optimization proportionally than a shorter-running test.
If you provide any profile feedback data to Verilator and it cannot use it,
it will issue the PROFOUTOFDATE warning that threads were
scheduled using estimated costs. This usually indicates that the profile
data was generated from a different Verilog source code than Verilator is
currently running against. Therefore, repeat the data collection phase to
create new profiling data, then rerun Verilator with the same input source
files and that new profiling data.
Compiler Profile-Guided Optimization
GCC and Clang support compiler profile-guided optimization (PGO). This optimizes any C/C++ program, including Verilated code. Using compiler PGO typically yields improvements of 5-15% on both single-threaded and multithreaded models.
Please see the appropriate compiler documentation to use PGO with GCC or Clang. The process in GCC 10 was as follows:
Compile the Verilated model with the compiler’s “-fprofile-generate” flag:
verilator [whatever_flags] --make \
    -CFLAGS -fprofile-generate -LDFLAGS -fprofile-generate
Or, if calling make yourself, add -fprofile-generate appropriately to your Makefile.
Run your simulation. This will create *.gcda file(s) in the same directory as the source files.
Recompile the model with -fprofile-use. The compiler will read the *.gcda file(s).
For GCC:
verilator [whatever_flags] --build \
    -CFLAGS "-fprofile-use -fprofile-correction"
For Clang:
llvm-profdata merge -output default.profdata *.profraw
verilator [whatever_flags] --build \
    -CFLAGS "-fprofile-use -fprofile-correction"
or, if calling make yourself, add these CFLAGS switches appropriately to your Makefile.
Clang and GCC also support -fauto-profile, which uses sample-based feedback-directed optimization. See the appropriate compiler documentation.
Runtime Debugging
To debug a Verilated executable, Verilate with --runtime-debug.
This will instruct the compiler to insert debugger, and enable various
library assertions. These options slow down the executable, so do this only
when debugging.
If you are using your own Makefiles, adapt appropriately to pass the
options documented under --runtime-debug to the compiler and
linker.
Once you have a debugging-enabled executable, run it using the the standard
GNU debugger gdb or a similar tool, and create a backtrace; e.g.:
gdb obj_dir/Vtop
  run {Vtop_command_arguments}
  {Vtop prints output, perhaps a segmentation faults}
  bt
Rarely the bug may disappear with --runtime-debug; if so, try
instead using the sub-options that --runtime-debug documents, to
find the maximum subset that still shows the issue. E.g. it is likely that
using -CFLAGS -D_GLIBCXX_DEBUG will not hide any bug, so may be used.
Using --runtime-debug or -CFLAGS -DVL_DEBUG=1 will only print a
message if something goes wrong. To enable debug print messages at runtime,
additionally use the +verilator+debug runtime option.