verilator_gantt
Verilator_gantt creates a visual representation to help analyze Verilator multithreaded simulation performance by showing when each macro-task starts, ends, and when each thread is busy or idle.
For an overview of the use of verilator_gantt, see Code Profiling.
Gantt Chart VCD
Verilated_gantt creates a value change dump (VCD) format dump file which may be viewed in a waveform viewer (e.g., C<GTKWave>):
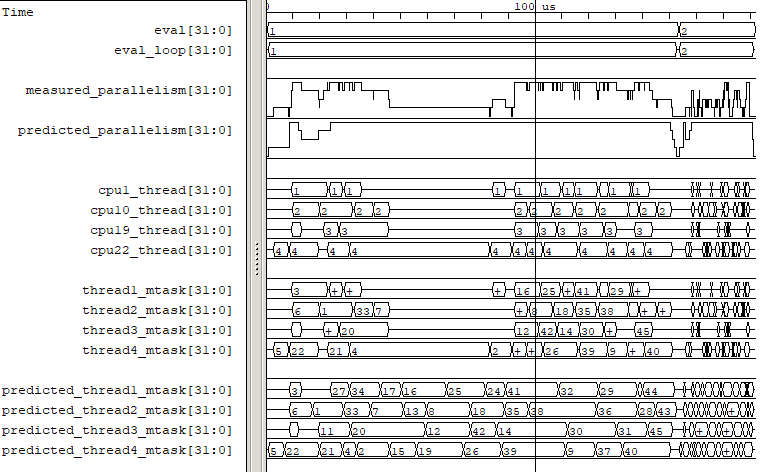
Fig. 2 Example verilator_gantt output, as viewed with GTKWave.
The viewed waveform chart has time on the X-axis, with one unit for each time tick of the system’s high-performance counter.
Gantt Chart VCD Signals
In waveforms, there are the following signals. In GTKWave, use “decimal” data format to remove the leading zeros and make the traces easier to read.
- trace/section
Shows the name of the current top of the execution section stack. Set GTKWave data format to “ASCII”.
- trace/depth
Shows the depth of the execution section stack. Set GTKWave data format to “Analog”.
- measured_parallelism
The number of mtasks active at this time, for best performance, this will match the thread count. In GTKWave, use a data format of “analog step” to view this signal.
- predicted_parallelism
The number of mtasks Verilator predicted would be active at this time, for best performance this will match the thread count. In GTKWave, use a data format of “analog step” to view this signal.
- cpu#_thread
For the given CPU number, the thread number measured to be executing.
- cpu#_waiting
For the given CPU number, aggregated waiting time for mtask dependencies. Visualized as X values.
- mtask#_cpu
For the given mtask id, the CPU it was measured to execute on.
- thread#_mtask
For the given thread number, the mtask id it was executing.
- predicted_thread#_mtask
For the given thread number, the mtask id Verilator predicted would be executing.
verilator_gantt Example Usage
verilator_gantt --help
verilator_gantt --version

verilator_gantt profile_exec.dat
verilator_gantt Arguments
- <filename>
The filename to read data from; the default is “profile_exec.dat”.
- --help
Displays a help summary, the program version, and exits.
- --no-vcd
Disables creating a .vcd file.
- --vcd <filename>
Sets the output filename for vcd dump; the default is “verilator_gantt.vcd”.